
When a website feels slow, the first instinct is to search for a website speed test, paste in a URL, and look for a score. The test finishes, the report displays several numbers, and the next question is harder: which result should you trust, and what should you fix first?
The answer depends on what you want to discover. One test may help inspect a page under controlled conditions. Another may show a waterfall of individual requests. A broader audit can help you look for issues outside speed alone. No single number explains every part of a website experience.
Why tools show different results
A page is a collection of requests: HTML, CSS, JavaScript, images, fonts, analytics, video embeds, chat widgets, and other resources. Browsers download and process them in a sequence influenced by server performance, network conditions, cache, device, and page code.
Tools may use different testing locations, devices, connection settings, cache states, and measurement methods. A test from a nearby data center may not reflect the experience of a visitor far away. A cached run may be faster than a first visit. Therefore, compare the purpose and evidence in each report rather than treating two scores as directly equivalent.
Google PageSpeed Insights
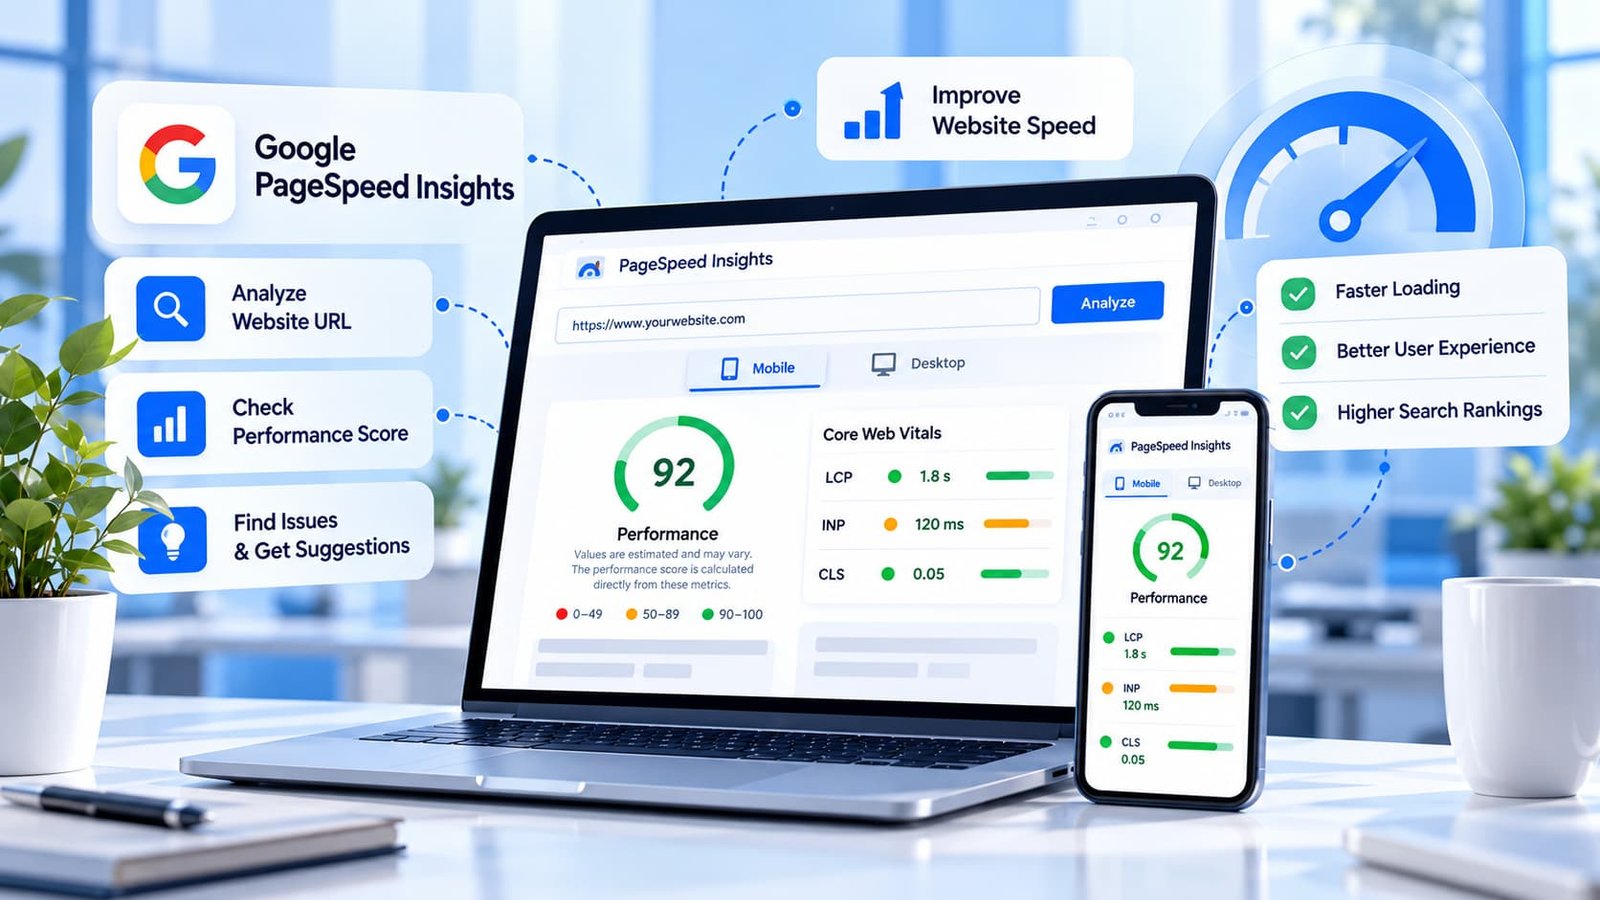
PageSpeed Insights analyzes a URL for mobile and desktop. It can show Lighthouse lab data and, when sufficient data is available, field data based on real Chrome users. Lab data helps investigate problems in a controlled test. Field data gives insight into real visitor experiences over a recent period.
Use it to examine Core Web Vitals and diagnostics such as image delivery, render-blocking resources, and JavaScript work. It can point you toward an issue, but it does not automatically modify your website. You still need to identify the cause and apply a safe fix.
Pingdom and request timing
Pingdom Website Speed Test is often used to inspect page loading and individual requests. Its waterfall-style view can help reveal which resources load early, which take longer, and whether the page is requesting many assets.
For example, a page may load several font files, large images, third-party scripts, and a video embed. The request view helps you investigate the sequence. However, the longest request is not automatically the most important issue. A request might finish after the main content is already visible, while a smaller resource could block rendering. Ask what the resource does and whether it affects the visitor’s first view or ability to interact.
Add SiteAuditScan.com to the workflow
Speed tests focus on performance and loading behavior. SiteAuditScan.com can complement those tests with the audit checks available in its current workflow. Use it as a wider review step, not as a claim that it duplicates every feature of PageSpeed Insights or Pingdom.
Visit https://siteauditscan.com/ and review the report it provides for your website. Verify findings before changing code, and do not assume every tool checks the same items or uses the same methodology.
A repeatable testing process
1. Pick a meaningful URL. Test the landing page, service page, blog article, product listing, product detail page, or another page people use. A homepage may have a different template and fewer scripts than the page where visitors convert.
2. Test mobile and desktop. Run PageSpeed Insights on both. Record the main metrics and significant warnings. If your audience mostly uses phones, prioritize mobile, but do not ignore desktop if it matters to your customers.
3. Repeat the test. Results can vary. Run the same test more than once and look for consistent patterns instead of reacting to one unusually fast or slow result.
4. Inspect the waterfall. Use Pingdom or another request-inspection tool to investigate large files, repeated requests, third-party resources, fonts, and scripts that may delay the initial view.
5. Run a broader audit. Use SiteAuditScan.com as an additional checkpoint. Separate confirmed problems from recommendations that need more investigation.
6. Group findings by root cause. A large image, a slow request, and delayed main content may all be symptoms of the same underlying issue. Group related findings rather than creating one task for every warning.
7. Fix one high-impact issue. Start with the problem most directly affecting visitors. Make the change in a safe environment where possible, then repeat the same tests.
Example: one page, multiple symptoms
Imagine a service page that feels slow on mobile. The HTML arrives quickly, but a large banner image takes time to download. PageSpeed Insights may identify the main content loading slowly, while a waterfall view shows the image request and its size. A broader audit may identify other issues that need separate attention.
The useful response is not to keep running tests until a better score appears. Check whether the banner is larger than needed, whether the correct responsive image is served, and whether the browser can discover it early. Re-test after making the change.
Another page may load quickly but respond slowly when a menu opens. Image compression will not solve expensive JavaScript work. Record the interaction, inspect the browser’s performance trace, and investigate the script responsible.
Common mistakes
– Testing only the homepage.
– Comparing tools without considering their different methods.
– Treating every warning as equally important.
– Removing useful features just to improve a number.
– Installing overlapping optimization plugins.
– Forgetting to test after deployment.
– Assuming a higher score guarantees better rankings or conversions.
Website speed test checklist
Test important pages on mobile and desktop; compare repeat runs; inspect request timing; review the main content and important interactions; use SiteAuditScan.com as a complementary audit step; verify the root cause; re-test after changes; and record what improved.
Conclusion
A website speed test is useful when it leads to a clear next step. Use PageSpeed Insights to understand metrics and diagnostics, Pingdom to investigate requests, and SiteAuditScan.com as part of a wider website review. Compare evidence, confirm root causes, fix the highest-impact issue, and measure again.